About
I'm a data scientist who enjoys building real-world, end-to-end systems.
I love creating projects that don't just stay in notebooks, but are deployed online where people can actually use them.
Projects I've worked on :
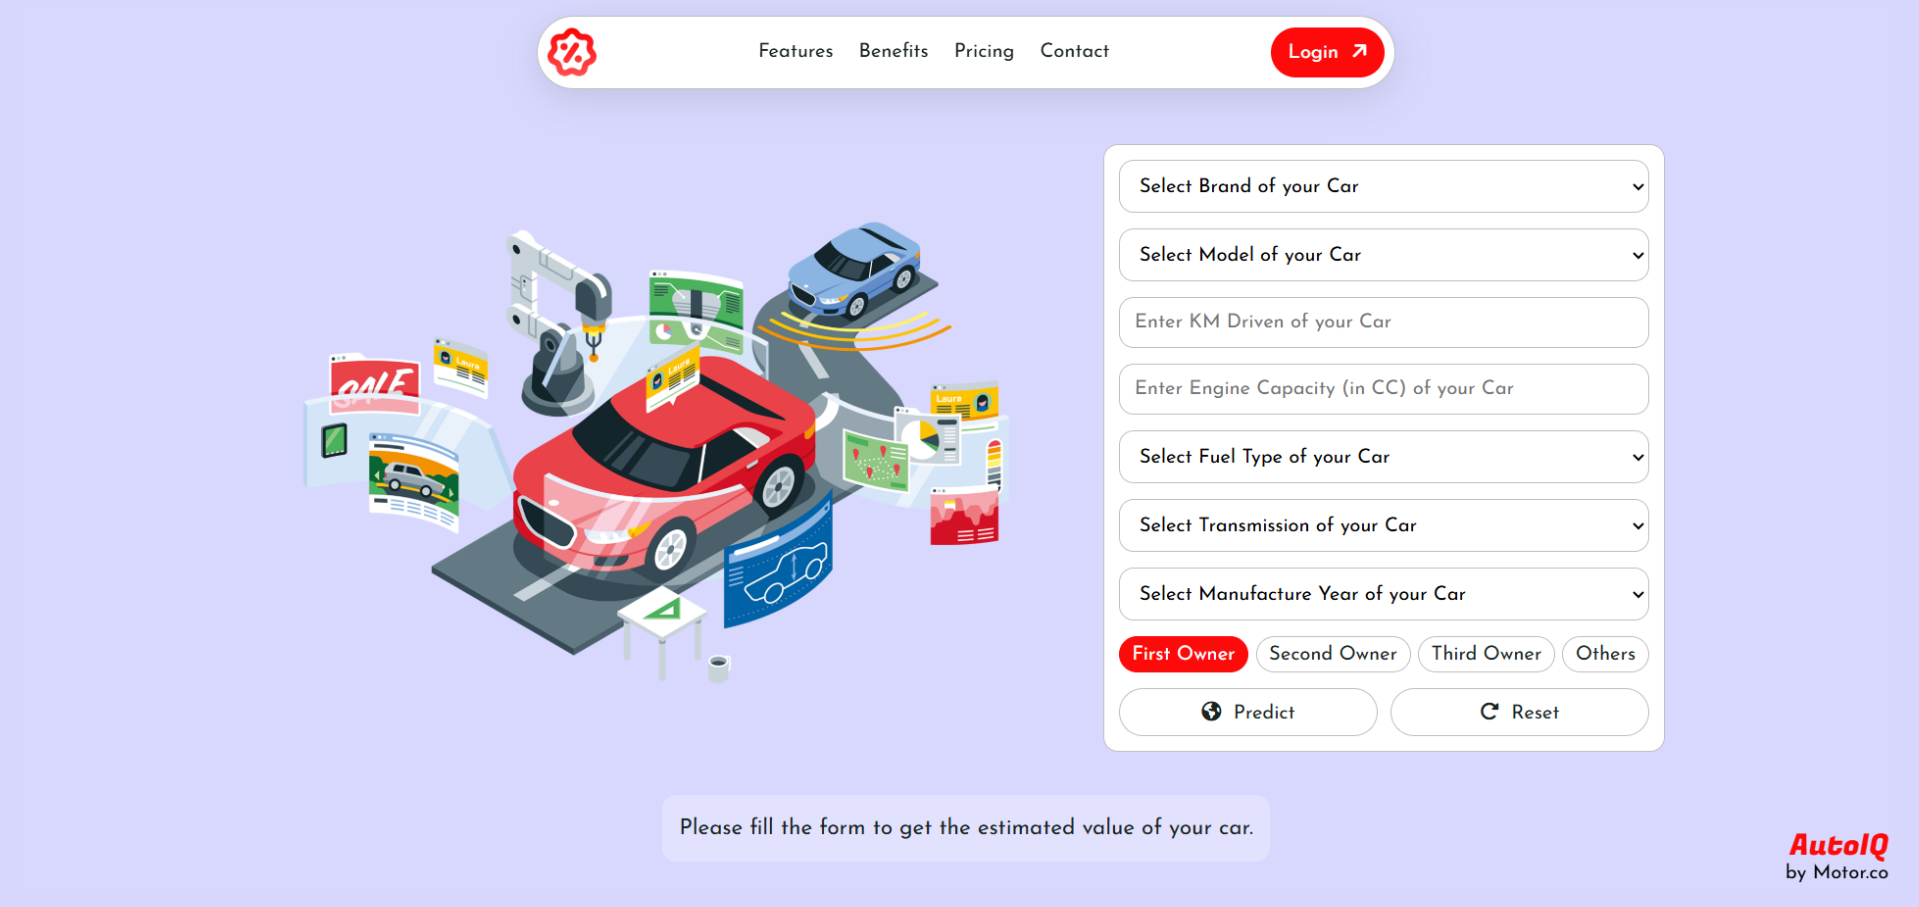
⊳ AutoIQ : Used Car Pricing System
→ Built an end-to-end car price prediction system with FastAPI and Docker, trained on 2,800+ records scraped from Cars24.
→ Deployed an interactive HTML/CSS/JS application on GitHub Pages that fetches real-time predictions via the API.
→ Tech Stack : Python, Pandas, BeautifulSoup, Selenium, Scikit-learn, FastAPI, Docker, Git
⊳ Dashly : Live Sales Dashboard
→ Designed a live Power BI dashboard connected to a Neon PostgreSQL database, containing 50,000+ sales records.
→ Automated an ETL pipeline with GitHub Actions to keep the dashboard updated everyday with real-time insights.
→ Tech Stack : Python, Pandas, SQLAlchemy, PostgreSQL, Power BI, GitHub Actions, Git
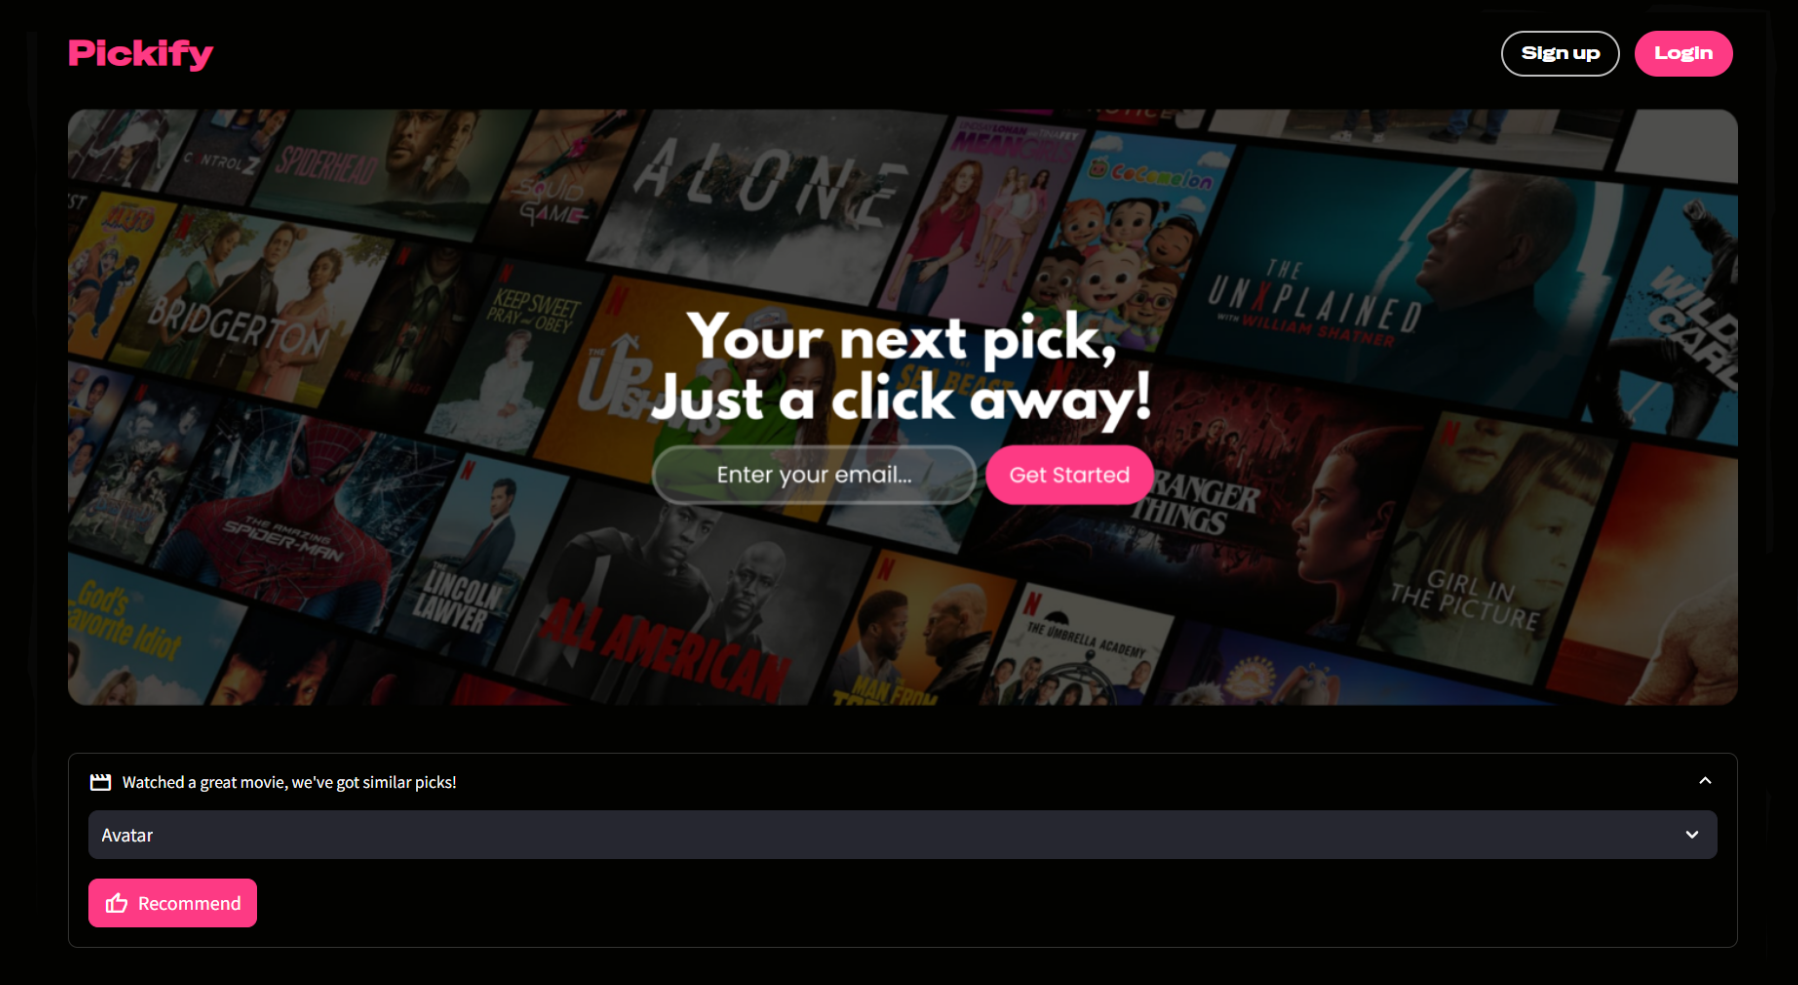
⊳ Pickify : Movie Recommender System
→ Developed a content-based movie recommender system using metadata from 5,000+ movies.
→ Integrated the TMDB API to fetch and display movie posters dynamically, for a personalized user experience.
→ Tech Stack : Python, Pandas, Scikit-learn, NLTK, Streamlit, TMDB API, Git
I'm currently seeking opportunities as a Junior Data Scientist or Junior Machine Learning Engineer.
If you're looking for someone who's eager to learn, collaborate, and build real-world solutions, I'd love to connect.
Skills
 Python
 NumPy
NumPy Pandas
 Matplotlib
 Seaborn
 Plotly
 Scikit-learn
 MySQL
MySQL Power BI
 Excel
Excel FastAPI
 Docker
 Git
Git GitHub
Actions
 Bash
BashProjects
AutoIQ
Problem
⊳ In the used car market, buyers and sellers often struggle to determine a fair price for their vehicles.
⊳ This project aims to provide an accurate and transparent pricing for used cars by analyzing real-world
data.
Solution
⊳ Built and deployed an end-to-end ML pipeline to predict used car prices from real-world data.
⊳ Collected and cleaned 2,800+ used car records from Cars24 using Selenium and BeautifulSoup.
⊳ Optimized dataset memory usage by 90% through downcasting data types and converting to Parquet.
⊳ Trained models with Scikit-learn Pipelines & ColumnTransformer to avoid data leakage.
⊳ Deployed the machine learning model as an API using FastAPI on Render.
⊳ Built an HTML/CSS/JS application hosted on GitHub Pages to interact with the API and display predictions.
⊳ Containerized the entire application using Docker and pushed to Docker Hub for reproducibility.
Impact
⊳ Achieved a 30% lower MAE and a 12% higher R2 score compared to the baseline regression model.
⊳ Reduced prediction error variance by 70%, ensuring more stable and reliable predictions.
Result
⊳ Helps car owners quickly find the right selling price for their vehicles based on real-world data.
⊳ Makes it easier for buyers to know if a car is fairly priced before making a purchase.
Dashly
Problem
⊳ Quick Buy is a leading superstore operating across the United States.
⊳ It manages thousands of product transactions daily across multiple regions.
⊳ The store's operations relied on manual spreadsheets and SQL queries to track business performance.
⊳ As a result, decision-making was slowed down and made it harder to identify growth opportunities.
Solution
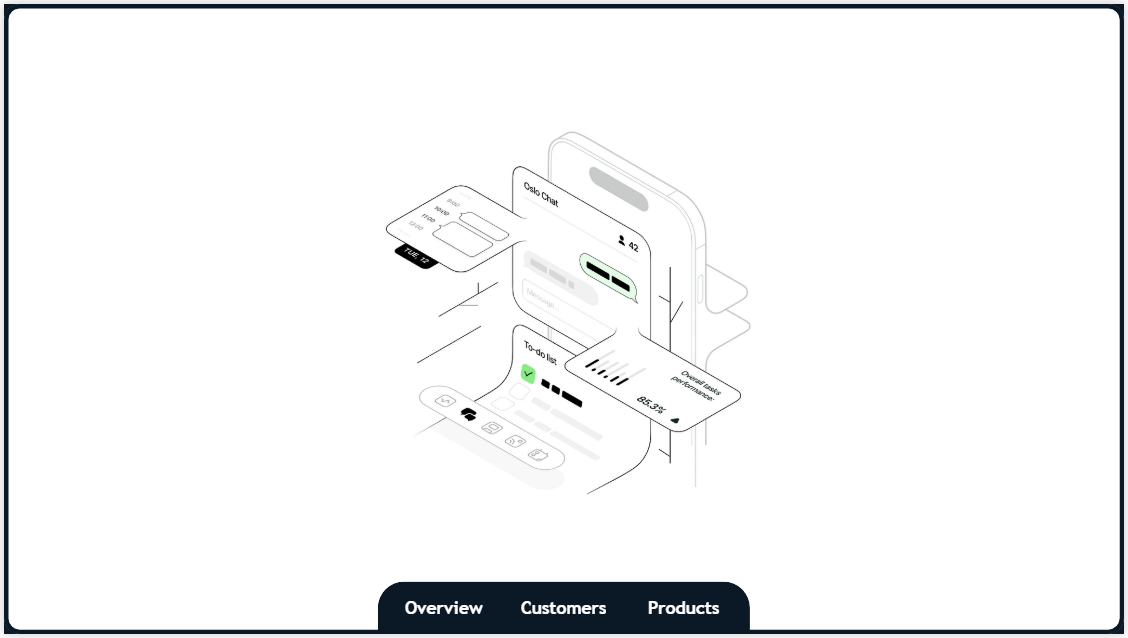
⊳ Built an automated ETL pipeline using Python, SQLAlchemy and GitHub Actions for daily
data updates.
⊳ Developed Python ETL scripts to extract, transform and load 50,000+ sales records into a Neon database.
⊳ Automated daily data generation (~100 new transactions daily) to simulate real-time sales activity.
⊳ Integrated Power BI with the Neon database, enabling real-time auto-refreshing dashboard.
Key Insights
⊳ Standard Class accounts for ~60% of sales (~₹5.1M) and profit (~₹897K), making it the top shipping mode.
⊳ Consumer Segment generates ~50% of revenue (~₹4.26M) and profit (~₹757K), the primary customer base.
⊳ Q4 (Oct-Dec) contributes ~27% of annual revenue, indicating strong seasonal demand, ideal for marketing.
⊳ Paper, Binders and Phones are the top-performing sub-categories, making up ~45% of total revenue.
⊳ West and East regions lead the market with ~58% of total sales, while South with ~19% has growth
potential.
⊳ Top 5 States (CA, NY, TX, PA, OH) contribute ~54% of sales, with CA alone driving ~21% of total sales.
Impact
⊳ Improved daily data update time from hours to under a minute (average ~45 sec) using GitHub Actions.
⊳ Reduced reporting time by 80% through automation, delivering updated insights in under a minute.
⊳ Delivered a reliable, low-latency, fully automated data pipeline with zero manual intervention.
⊳ Achieved 100% workflow reliability, with zero pipeline failures since deployment.
Pickify
Problem
⊳ With the rise of streaming services, viewers now have access to thousands of movies across platforms.
⊳ As a result, many viewers spend more time browsing than actually watching.
⊳ This problem can lead to frustration, lower satisfaction and reduced watch time on the platform.
⊳ Ultimately, this impacts both user experience and business performance.
Solution
⊳ Built a content-based movie recommender system trained on 5,000+ movie metadata records.
⊳ Generated the top 5 similar titles for any selected movie in under 3 seconds.
⊳ Integrated the TMDB API to dynamically fetch and display movie posters, enhancing user experience.
⊳ Deployed the system as a web app, used by 100+ users to discover personalized movie suggestions.
Impact
⊳ Reduces the time users spend choosing what to watch.
⊳ Increases user engagement, watch time and satisfaction.
⊳ Helps retain users by offering more personalized recommendations.
Netflix Data Analysis
Problem
⊳ To analyze Netflix content data, uncovering valuable insights into how the platform evolves over time.
Key Findings
⊳ Cleaned and analyzed a dataset of 8,000+ Netflix Movies and TV Shows.
⊳ More than 60% of the content on Netflix is rated for mature audiences.
→ Suggests that Netflix targets adult viewers to boost engagement and retention.
⊳ More than 25% of the Movies and TV Shows were released on the 1st day of the month.
→ Shows a consistent release schedule, likely aligned with subscription renewal cycles.
⊳ More than 40% of the content on Netflix is exclusive to the United States.
→ Shows a strong focus on U.S. market and content availability by location.
⊳ More than 20% of the content on Netflix falls under the "Drama" genre.
→ Confirms that "Drama" is a key part of Netflix's content library.
⊳ More than 23% of the content on Netflix was released in 2019 alone.
→ Indicates a major content push that year, possibly tied to growth or user acquisition efforts.

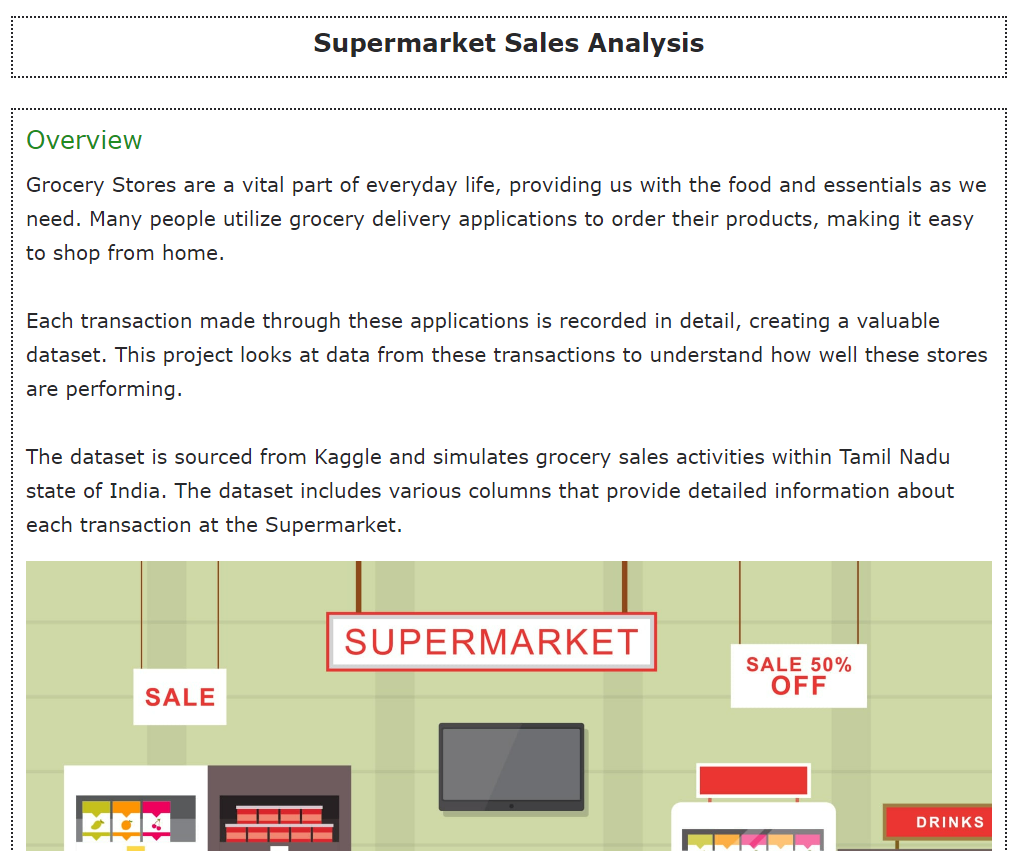
Supermarket Sales Analysis
Problem
⊳ To analyze Supermarket Sales data, identifying key factors for improving profitability and efficiency.
Key Findings
⊳ Analyzed purchasing patterns of 9,000+ customers of a Supermarket.
⊳ More than 15% of the products sold were Snacks.
→ Shows that Snacks are a convenient choice and a major source of revenue.
⊳ More than 32% of total sales came from the West region of the supermarket.
→ Suggests that West region is a strong-performing area as compared to others.
⊳ Health and Soft drinks were the most profitable sub-categories in beverages.
→ Shows that both type of drink options perform well among customers.
⊳ November was the most profitable month contributing about 15% of the total annual profits.
→ Makes it an ideal time for running promotions and special offers.
